New Ad 1

New 1

‏إظهار الرسائل ذات التسميات PMI-ACP. إظهار كافة الرسائل

الثلاثاء، 5 يونيو 2018

How Many People in the World are PMP Certified & How many in other Certifications

Project Management Institute (PMI) Certifications became so popular and accredited around the world, each year the number of the certified people is increasing due to the reputation and the well-recognition of PMI, below are a statistical data for the main PMI certifications' holders up to 1st January 2018:


PMP® – There are 825,413 (Project Management Professional Certified around the World)

** Top countries that have PMP holders are:
1. United States .. more than 250,000 Holder
2. China .. more than 100,000 Holder
3. India .. more than 50,000 Holder
4. Japan .. more than 40,000 Holder
5. Canada .. more than 30,000 Holder


CAPM® –  Around 35,000 (Certified Associate in Project Management)


PMI-ACP® – Around 18,000 (PMI® Agile Certified Practitioner)

PMI-RMP® – Around 5,000 (PMI® Risk Management Professional)

PMI-SP® – Around  2,000 (PMI® Scheduling Professional)

PgMP® – Around 2,000 (Program Management Professional)

PMI-PBA® – Around 2,000 (PMI® Professional in Business Analysis)

PfMP® – Around 500 (Portfolio Management Professional)

الأربعاء، 30 مايو 2018

Critical Path Method in PMP Exam

Critical Path Method (CPM)
Critical Path is the LONGEST duration path through a network diagram and determines the shortest or earliest time to complete the project.

The Critical path is calculated by Adding up the duration's of activities of each path in a network diagram. The longest path is the critical path (The longest path duration = The shortest time
a project takes to finish all its activities).


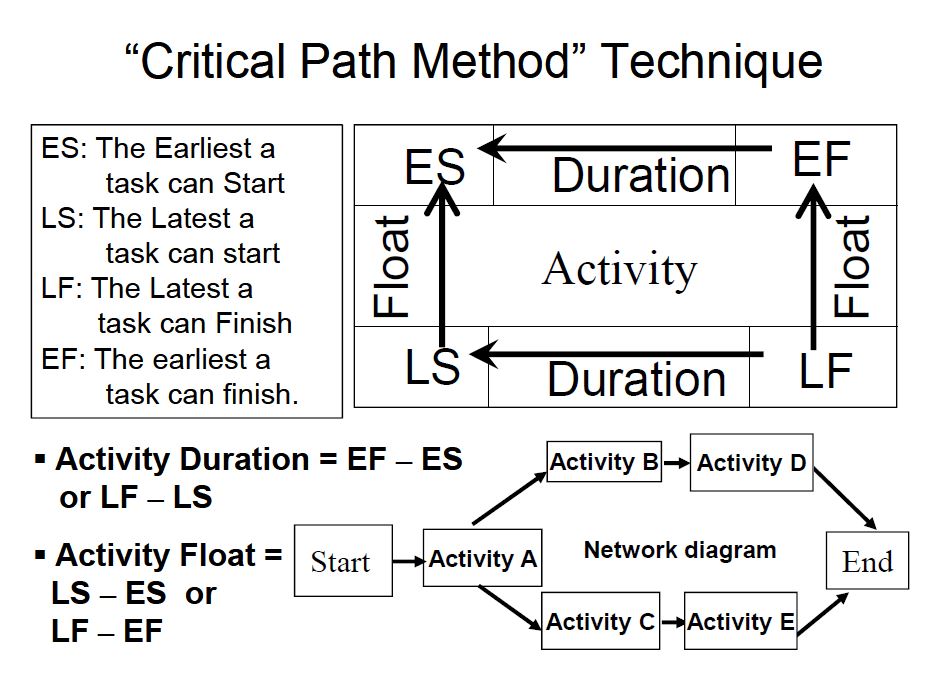
This technique calculates theoretical EARLY start & Finish dates( ES & EF ) and LATE Start & Finish ( LS & LF) dates ,for all activities Regardless for any resource limitations.

Calculations of ES,EF : performing a forward pass analysis through the schedule network [from the beginning of the project to the task and following the dependencies in the network diagram].

Calculations of LS, LF: performing a backward pass analysis through the schedule network. [from the end of the project to the task and following the dependencies in the network diagram].


Most Project Management software's calculate ES EF LS LF for you, but you must be able to calculate
them manually on PMP exam.


The resulting dates ( ES,EF,LS,LF) are not necessarily the schedule
network; rather, they indicate the followings:

- TIME PERIODS within which the schedule activities could be scheduled.
Given activity duration
- Logical relationships.
- LEAD & LAG and other known constraints.
- Calculating ES,EF,LS,LF may be affected by the activity Total Float.


Total Float (slack): The amount of time that a schedule activity may be delayed from its early start date without delaying the project completion date or violating a schedule constraint.

Total Float is termed as schedule flexibility and is measured by the
positive difference between Early and Late dates (LF-EF or LS-ES).


  •  Total float may be Positive(we can wait), Negative(We need to speed up the Work on this activity) or Zero(No any delay).
  •   The “critical path” has either Zero or Negative total float. But critical path is normally characterized by Zero total float on the critical path.
  •   Adjustments to activity duration, logical relationships, leads and lags or other schedule constraints may be necessary to produce network paths with a zero or positive total float.

􀂉 The activities in the critical path are called “Critical Activities” and almost always have no slack (Slack=0)
􀂉 The total float provides schedule flexibility.

Once the total float for a network path has been calculated then the Free float can also be determined.

􀂃􀂃 Free Float (Slack): The amount of time that an activity can be delayed without delaying the early start date of any immediate successor activity within the network path.
􀂃􀂃 Project Float (Slack): The amount of time a project can be delayed without delaying the externally imposed project completion required by the customer, sponsor or management.
􀂃􀂃 Near Critical Path: a Path with low float. A network diagram can have

multiple near critical paths.

Free PMP Exam 
http://academyoflions.blogspot.com/2016/11/free-pmp-online-training-course.html
Float is extremely useful for:

– The project manager: Better allocation of rescourses among other areas of the project.

– Team members: To juggle multiple projects  
􀂃􀂃 The critical Path Method technique has the following benefits:
􀀹􀀹 It proves the project time estimate.
􀀹􀀹 It helps project compression.
􀀹􀀹 It indicates where to focus and what to monitor.
􀀹􀀹 It indicates what could be delayed.
􀀹􀀹 It Shows what requires immediate action.

􀀹􀀹 PM should monitor & control the Near–Critical Path as well.

Example I:


- In order to solve such questions which appear always in PMP exam, first you have to determine the possible paths exist in the chart.

(Start) - A-B-C-D-E-K - (End)

(Start) - A-B-F-G-H-J-K - (End)

(Start) - A-B-I-J-K - (End)

- Second step is to determine the length of each path based on the duration gived in the chart for each activity:

(Start) - A-B-C-D-E-K - (End)  *31 Days*

(Start) - A-B-F-G-H-J-K - (End) *43 Days*

(Start) - A-B-I-J-K - (End) *33 Days*

- So based on the definition of the Critical Path which is the LONGEST duration path through a network diagram, the critical path will be the second path : (Start) - A-B-F-G-H-J-K - (End) 


Example II:


- First Step: draw the network diagram :

- Second Step: determine the Critical path:
                        

- Third Step: determine the ES, EF, LS & LF for each activity:


- Now it is easily to calculate the float for each activity as the ES, EF and LS, LF are known for all activities.

الخميس، 24 نوفمبر 2016

The Most Important Equations in Cost Management in PMP & in PMI-ACP Exams


Cost Variance (CV)
CV = EV – AC
EV = Earned Value
AC = Actual Cost
< 0    Over budget
= 0    On budget
> 0    Within budget


Schedule Variance (SV)
SV = EV – PV
EV = Earned Value
PV = Planned Value
< 0    Behind schedule
= 0    On schedule
> 0    Ahead of schedule
Cost Performance Index (CPI)
CPI = EV/AC
EV = Earned Value
AC = Actual Cost
< 1    Over budget
= 1    On budget
> 1    Under budget

sometimes the term ‘cumulative CPI’ would be shown, which actually is the CPI up to that moment


Schedule Performance Index (SPI)
SPI = EV/PV
EV = Earned Value
PV = Planned Value
< 1    behind schedule
= 1    on schedule
> 1    ahead of schedule
Estimate at Completion (EAC) if original is flawed
EAC = AC + New ETC
AC = Actual Cost
New
ETC = New Estimate to Completion
if the original estimate is based on wrong data/assumptions or circumstances have changed
Estimate at Completion (EAC) if BAC remains the same
EAC = AC + BAC – EV
AC = Actual Cost
BAC = Budget at completion
EV = Earned Value
the variance is caused by a one-time event and is not likely to happen again
Estimate at Completion (EAC) if CPI remains the same
EAC = BAC/CPI
BAC = Budget at completion
CPI = Cost performance index
if the CPI would remain the same till end of project, i.e. the original estimation is not accurate
Estimate at Completion (EAC) if substandard performance continues
EAC = AC + [(BAC -EV)/(CPI*SPI)]
AC = Actual Cost
BAC = Budget at completion
EV = Earned Value
CPI = Cost Performance Index
SPI = Schedule Performance Index
use when the question gives all the values (AC, BAC, EV, CPI and SPI), otherwise, this formula is not likely to be used
To-Complete Performance Index (TCPI)
TCPI = (BAC –EV)/
(BAC – AC)
BAC = Budget at completion
EV = Earned value
AC = Actual Cost
TCPI = Remaining Work
/Remaining Funds
BAC = Budget at completion
EV = Earned value
CPI = Cost performance index
< 1    Under budget
= 1    On budget
> 1    Over budget
Estimate to Completion 
ETC = EAC -AC
EAC = Estimate at Completion
AC = Actual Cost
Variance at Completion
VAC = BAC – EAC
BAC = Budget at completion
EAC = Estimate at Completion
< 0    Over budget
= 0    On budget
> 0    Under budget
PERT Estimation (3 Points Estimate)
(O + 4M + P)/6
O= Optimistic estimate
M= Most Likely estimate
P= Pessimistic estimate
Standard Deviation
(P – O)/6
O= Optimistic estimate
P= Pessimistic estimate
this is a rough estimate for the standard deviation
Float/Slack
LS – ES
LS = Late start
ES = Early start
LF – EF
LF = Late finish
EF = Early finish
= 0    On critical path
< 0    Behind schedule


Communication Channels
n (n-1)/2
n = number of members in the team
n should include the project manager

e.g. if the no. of team members increase from 4 to 5, the increase in communication channels:
5(5-1)/2 – 4(4-1)/2 = 4


One Point Estimate
(O + M + P)/3
O= Optimistic estimate
M= Most Likely estimate
P= Pessimistic estimate


K4

Most Repeated Topics in Reading Section in TOEFL Exams

Reading Section is one important part in both IELTS & TOEFL Exams which constitute 25% of the overall score in exam. After studying Hun...

text ad

Sidebar

lacademy